| |
|

|
|||
 |
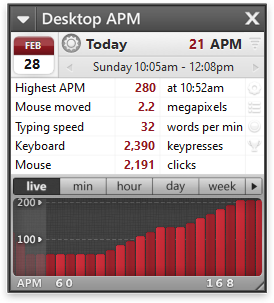
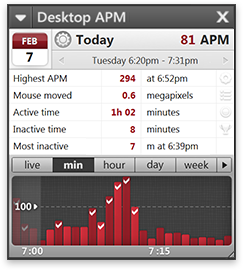
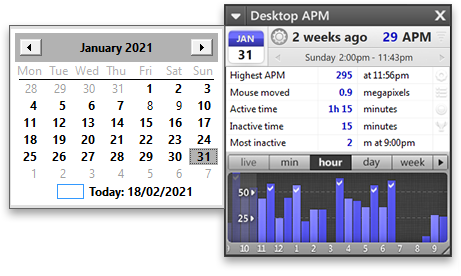
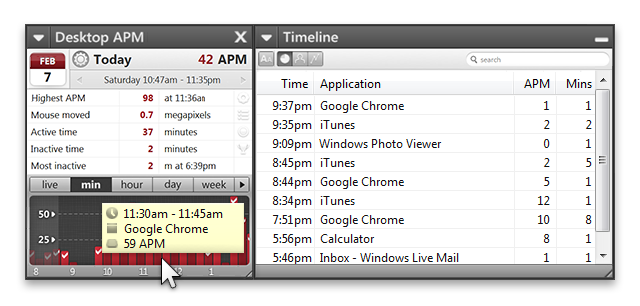
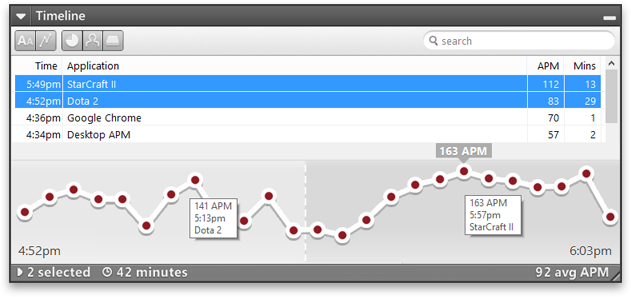
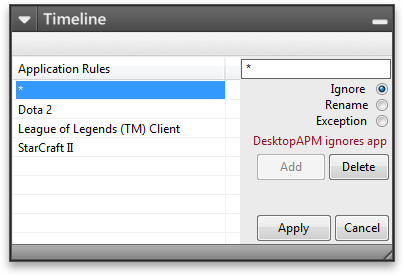
Many features are waiting for you in Desktop APM.
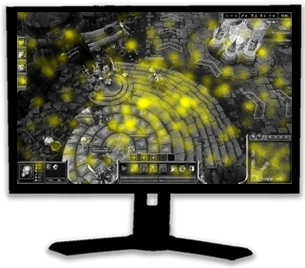
Hotspots show where you click the most, set daily targets, export to spreadsheets and more.
![]()
![]()
"DESKTOP APM can motivate you to increase your performance in work and gaming...
which can finally lead to enhanced responsiveness and multitasking skills." - Softpedia![]()
"DESKTOP APM is a tightly-coded utility that targets a very specific niche, and I love those kind of things.
Feeling good about what you're doing is part of being productive, after all!." - Dave.Sri